The Alde & Ore Association

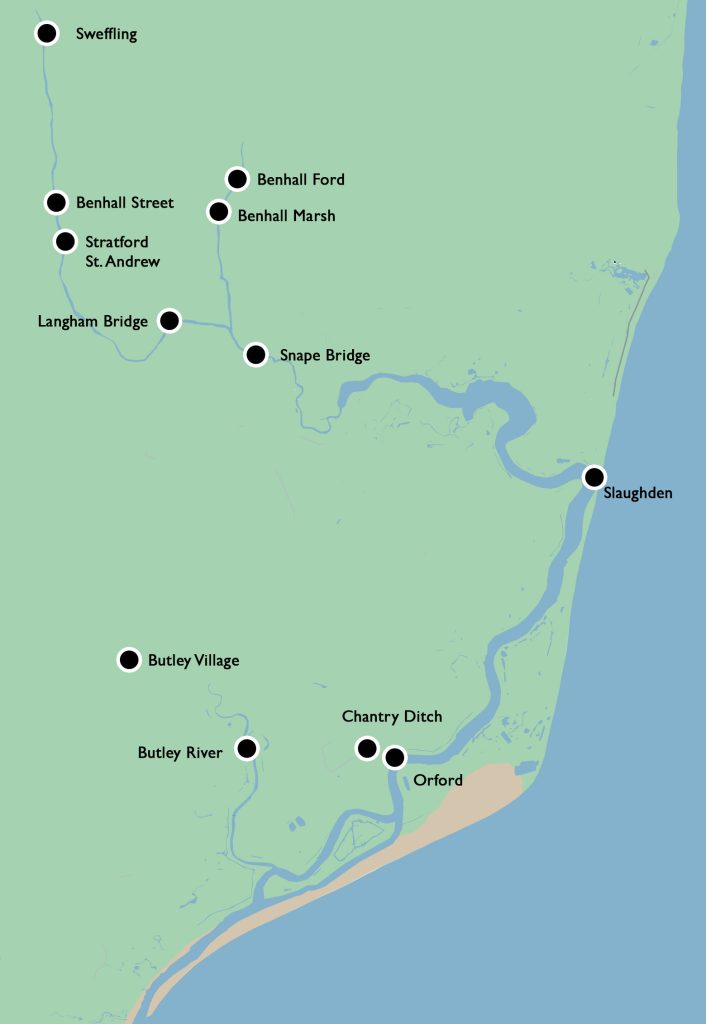
This chart is compiled from weekly analyses which are averaged to produce quarterly results for each of the sampling sites.
Measurement units: milligrams per litre of sampled water (mg/l).
For phosphates (expressed as elemental phosphorus P) good quality is at or below the level of 0.1 mg/l and is shown as the horizontal line on the chart.
